Comet 4c - Flight Performance
14/01/10 12:00
It is testament to Laminar Research’s expertise that, by entering the basic geometry and specifications of a real aircraft in X-Plane, one gets something that flies well, straight out of the box. However, as one begins to compare the model with real performance data, one finds inaccuracies, either in the simulator, or (more likely) in one’s original specifications.
Part of the reason is that manufacturers rarely publish data in exactly the right form to plug into Plane Maker. For example, I do not have a figure for the overall drag, but I do have very precise data about the rate of climb and descent in a wide range of condition, and the engine settings and fuel consumption when cruising with different payloads, and a range of altitudes and temperatures. A sequence of tests enabled me to pin down the variables:
Stall Speed - Clean Configuration
Getting the stall speed right established the maximum lift, making small changes to the aerofoils.
Stall Speed - Flaps Out
Having established the lift in clean configuration, this test established the extra lift generated by the flaps.
Unstick Speed
Not strictly necessary, but it served as a practical confirmation that the lift settings were good.
Descent
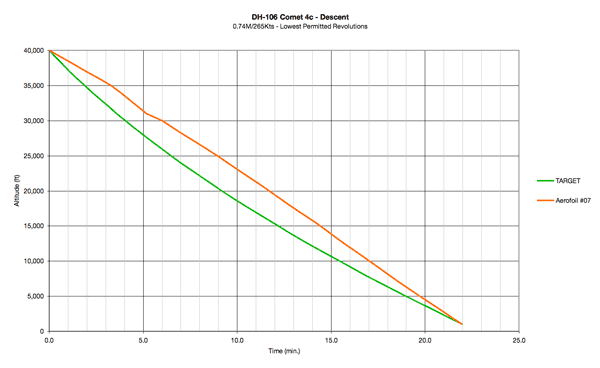
Having set the lift, a descent in clean configuration, with the engines throttled back, would establish the overall drag. The drag from the aerofoils can be calculated, but this test would find the additional drag from the thick wing root, containing the engines, and other jutting paraphernalia.
Level Cruise
Having established lift and drag, cruising at fixed altitude was used to adjust the engine power and fuel consumption.
Climb
Climb tests, while not strictly necessary, were yet another confirmation of all the above.
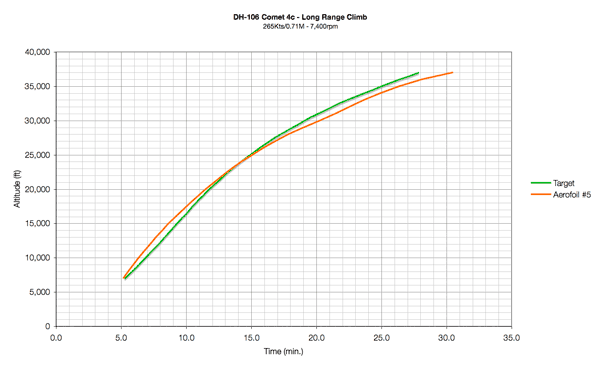
It was usually possible to get one test result pretty accurate, but not all of them at the same time. Climb and cruise were affected by X-Plane’s engine model, which is not accurate for a pure turbojet (see Engine Performance). In the end, the sequence of tests became a cycle, making finer and finer adjustments each time. The final figures gave accurate take off and landing speeds, accurate fuel consumption during cruise, and the following rates of climb and descent:

Long range climb is within 7%, but the graph shows the result of slightly greater engine thrust at low altitude, and less at high altitude than in real life.

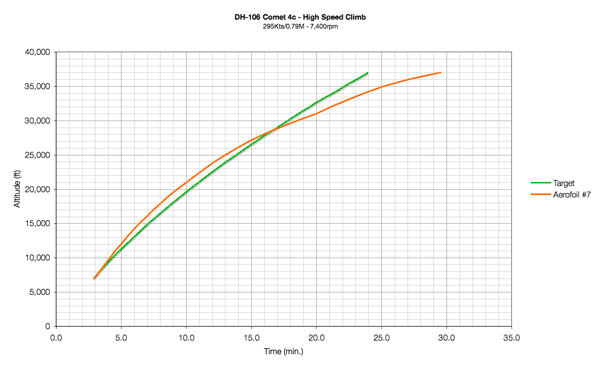
This gap in real vs simulated performance becomes wider at higher Mach numbers.

Overall drag was adjusted against the descent time from 40,000 to 1,000 feet.
--
GMM-P (14/01/2010)
Part of the reason is that manufacturers rarely publish data in exactly the right form to plug into Plane Maker. For example, I do not have a figure for the overall drag, but I do have very precise data about the rate of climb and descent in a wide range of condition, and the engine settings and fuel consumption when cruising with different payloads, and a range of altitudes and temperatures. A sequence of tests enabled me to pin down the variables:
Stall Speed - Clean Configuration
Getting the stall speed right established the maximum lift, making small changes to the aerofoils.
Stall Speed - Flaps Out
Having established the lift in clean configuration, this test established the extra lift generated by the flaps.
Unstick Speed
Not strictly necessary, but it served as a practical confirmation that the lift settings were good.
Descent
Having set the lift, a descent in clean configuration, with the engines throttled back, would establish the overall drag. The drag from the aerofoils can be calculated, but this test would find the additional drag from the thick wing root, containing the engines, and other jutting paraphernalia.
Level Cruise
Having established lift and drag, cruising at fixed altitude was used to adjust the engine power and fuel consumption.
Climb
Climb tests, while not strictly necessary, were yet another confirmation of all the above.
It was usually possible to get one test result pretty accurate, but not all of them at the same time. Climb and cruise were affected by X-Plane’s engine model, which is not accurate for a pure turbojet (see Engine Performance). In the end, the sequence of tests became a cycle, making finer and finer adjustments each time. The final figures gave accurate take off and landing speeds, accurate fuel consumption during cruise, and the following rates of climb and descent:

Long range climb is within 7%, but the graph shows the result of slightly greater engine thrust at low altitude, and less at high altitude than in real life.

This gap in real vs simulated performance becomes wider at higher Mach numbers.

Overall drag was adjusted against the descent time from 40,000 to 1,000 feet.
--
GMM-P (14/01/2010)
blog comments powered by Disqus
