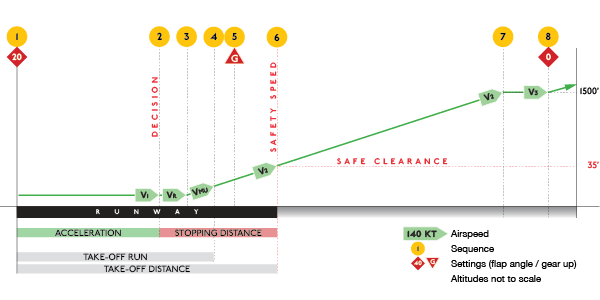
Comet 4c - Take Off Flight Path
01/07/16 05:00

Fig.1: Net Take-Off Flight Path (click to enlarge).
Stall tests helped me tune the aerofoils and flaps for lift. Take-Off tests are another confirmation that the lift is good, and because the de Havilland manuals specify speeds, distances and gradients for each stage of the take-off path, they enable me to check and adjust flap drag, landing gear drag and wheel rolling resistance to hit the marks as accurately as possible.
Obviously, this requires flying exactly to the procedure in the manual. With reference to Fig.1, this is described below:
1 Start of run. Flaps 20. Full power on all engines. Release brakes. 2 V1 : Decision speed, up to which the aircraft could still be stopped safely on the runway. Quoted performance and tests include one engine failure at V1 3 VR : Rotate to lift off at the scheduled unstick speed (usually 7-10 kt. less than VMU). 4 VMU : Minimum unstick speed (lift-off). Distance to lift off is the "Take-Off Run". 5 Landing gear raised immediately after lift-off. 6 V2 : Free-air safety speed (flaps 20). The aircraft must attain or exceed this speed and clear any obstacle at the end of the runway by 35'. 7 Climb at full thrust on the remaining three engines at the free-air safety speed (flaps 20) to 1500 feet (AGL), then level out and let the aircraft accelerate to V3. 8 V3 : Free-air safety speed (flaps retracted). Raise flaps.
My own consistency with a yoke and pedals is not good enough for this, so I added a take-off test to my burgeoning flight-test plug-in. The plug-in used the built-in X-Plane autopilot, changing the autopilot settings, throttles, flaps and landing gear at the appropriate points. At the rotate speed, the autopilot was set to fixed pitch at a pre-determined angle. The tests went through angles from 6-12 degrees at one-degree intervals.
The autopilot had some limitations. When the aircraft is very light, inertia is less, so the rate of change of pitch is higher. On the other hand, the airflow over the control surfaces is so much slower that the controls are less effective. Flying manually, I found big, bold movements on the controls were necessary at low speeds, backing off as soon as the nose began to lift. At higher speeds, the nose would lift with much smaller inputs, but the inputs needed to be sustained or increased gently and gradually. The autopilot could not make such a distinction. At very low weights, the angle of attack at the scheduled unstick speed was never high enough to produce enough lift, so the aircraft failed to leave the ground. The only way to compensate was to rotate earlier than the manual suggested, to achieve a pitch of about 6 degrees at VMU, increasing to about 10 degrees at V2. The opposite was true at very high weights, where I found it necessary to delay rotation.
The table below shows the optimum results. During tests, I tried a number of variations, and it was interesting that the factory recommendations really did produce the best results. For example, raising the nose earlier, or more steeply, resulted in an earlier lift-off, and more clearance "over the hedge". However, the enormous amount of drag produced by increasing the angle-of-attack was far, far greater than the rolling resistance of the wheels, so V2 was not achieved. Keeping the nose down longer increased all the speeds, but also the take off run and take off distance. The figures quoted in the manual are an ideal compromise between airspeed and gradient.
The tests were carried out at sea level, and ISO (or ICAN) temperatures (i.e.: 15ºC at sea level), and no wind.
Take-Off Weight (lb.) 100,000 120,000 140,000 160,000 Optimum Pitch Set (deg.) 10 10 9 8 V1 (kt.) 81 92 103 110 Optimum VR (kt.) 94 (VMU–15) 109 (VMU–10) 122 (VMU–7) 130 (VMU–5) Lift-Off / Unstick (VMU) — Target speed (kt.) 109 119 129 135 — Actual speed (kt.) 108.9 118.3 128.4 134.5 — Pitch @ take-off (deg.) 6.0 6.7 6.3 4.8 Take-Off Run — Target distance (ft.) 1800 2600 3700 5100 — Actual distance (ft.) 1788 2593 3614 4489 V2 @ 35' AGL — Target speed (kt.) 114 125 135 145 — Actual speed (kt.) 118.0 124.7 134.5 143.8 — Pitch @ V2 (deg.) 10.3 10.2 9.2 8.0 Take-Off Distance — Target distance (ft.) 2600 3500 4800 6500 — Actual distance (ft.) 2565 3472 4780 6406 Distance to 1500 ft. AGL — Target distance (ft.) 9000 12500 18000 25500 — Actual distance (ft.) 8884 12055 17837 23666 1500 ft. @ V3 — Target distance (ft.) 10000 14000 19000 27000 — Actual distance (ft.) 8884 12364 19200 25618
Fig.2: Table of take-off performance, with engine failure at V1 (tests made with XP 10.45).
Next step: climb and descent tests.
--
GMM-P
(01-07-2016)
blog comments powered by Disqus
